|
This week we take a look at the top ten producers based in Canada, ranked by Total Enterprise Value (TEV) in U.S. dollars.
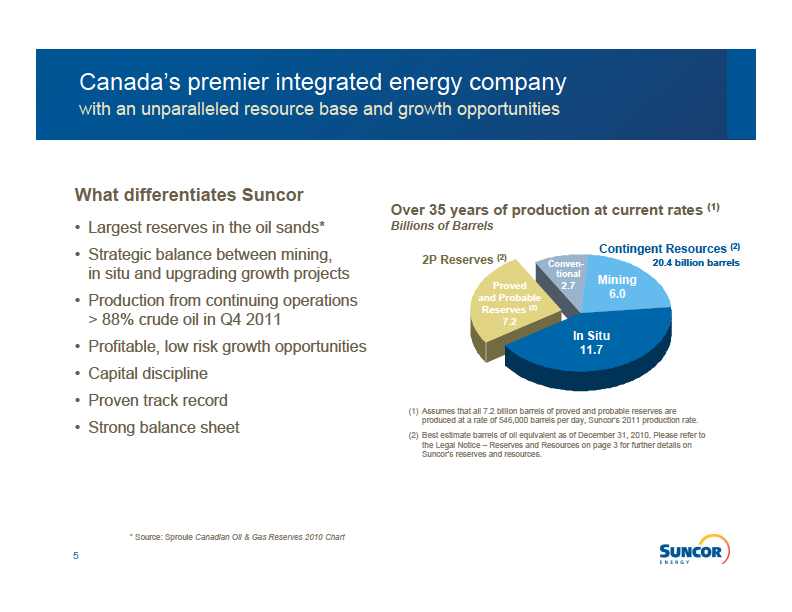
Since the firm's ~$19 billion merger with Petro-Canada in 2009, Suncor Energy has continued to grow and thus leads the group by a significant margin, currently valued at over $58 billion. Narrowing our focus to the upstream portion of the business, Suncor produced ~577 Mboe/d in 4Q 2011. The firm's main upstream focus is oil sands, boasting the largest reserves in the Canadian oil sands bar none. Suncor optimizes the value of its oil production through an integrated business model and access to global market pricing; as large as the firm currently is, we'd expect Suncor to be much larger in 2020, when it anticipates producing 1 MMboe/d.
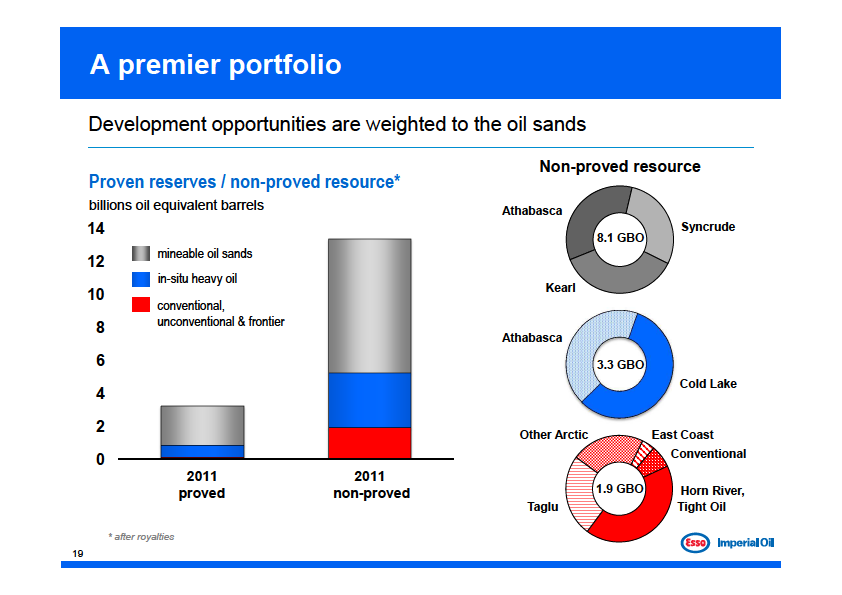
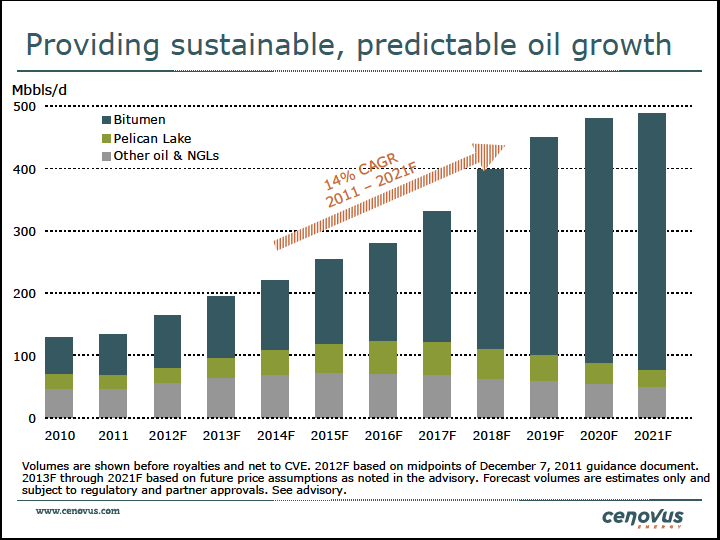
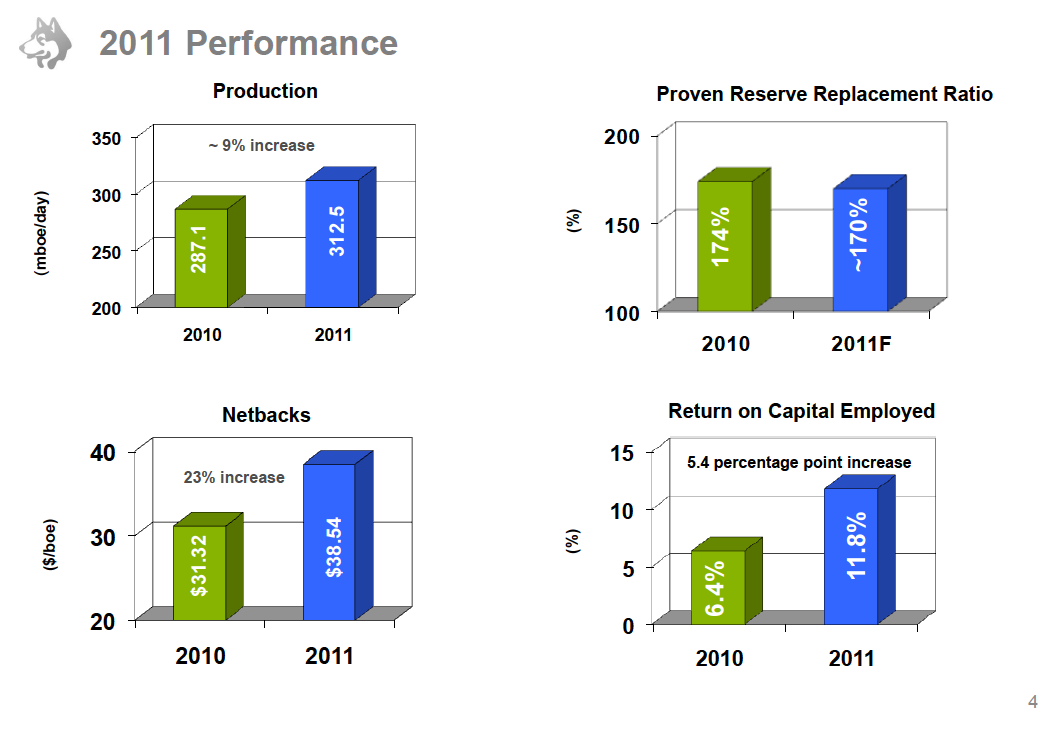
Above are slides from the top two Canadian-based producers -- Suncor Energy and Canadian Natural Resources. Below are slides from several others in the top 10: Imperial Oil, Cenovus Energy, Husky Energy and Talisman Energy. The table below shows size, volumes, P+P reserves and reserve and production metrics as of March 28, 2012.
Top 10 Canadian Producers by TEV ($USD) - as of 03/28/12| # | Company | TEV ($MM) | Vols (MBOED) | 2011YE P+P Reserves (MMBOE) | Prod Metric ($/BOED)1 | Res Metric ($/P+P BOE)1 |
|---|
| 1 | Suncor Energy | $57,889 | 577 | 5,847 | $100,414 | $9.90
| | 2 | Canadian Natural Resources | $44,677 | 658 | 7,5382 | $67,939 | $6.05
| | 3 | Imperial Oil | $37,924 | 2972 | NA | $129,797 | NA
| | 4 | Cenovus Energy | $32,048 | 254 | 2,060 | $126,039 | $15.56
| | 5 | Husky Energy | $27,282 | 319 | 2,361 | $85,550 | $11.55
| | 6 | Encana | $20,521 | 600 | 3,710 | $34,182 | $5.53
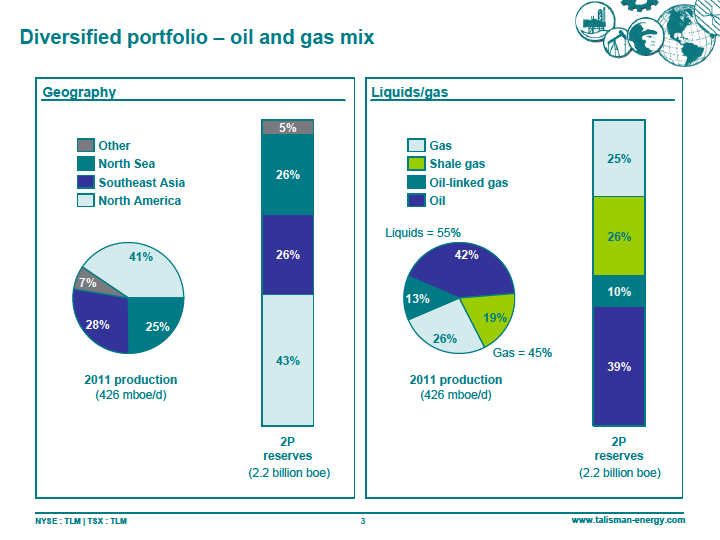
| | 7 | Talisman Energy | $17,926 | 442 | 1,859 | $40,556 | $9.64
| | 8 | Crescent Point Energy | $14,943 | 81 | 381 | $183,998 | $39.25
| | 9 | Nexen | $13,041 | 193 | 2,017 | $67,568 | $6.47
| | 10 | Penn West Petroleum | $12,605 | 169 | 616 | $74,676 | $20.46 |
1. Metrics not adjusted for refining or other business units.
2. Gross Numbers
|