Chevron, #3
October 28, 2011 |
BP, #4
October 25, 2011 |
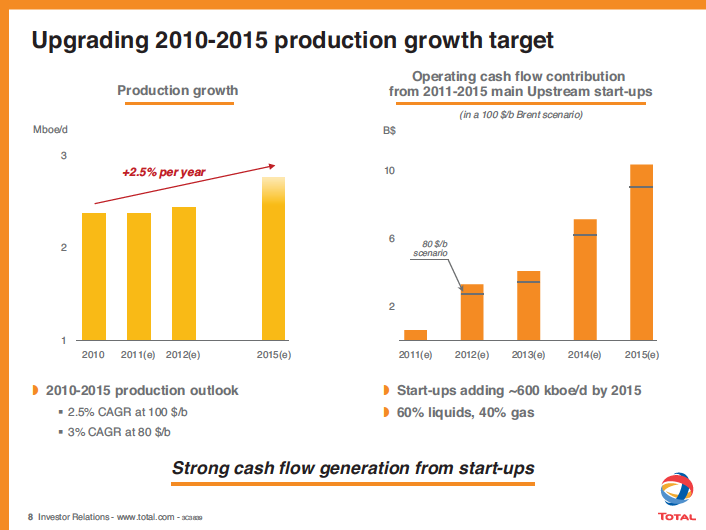
Total, #5
September 26, 2011 |
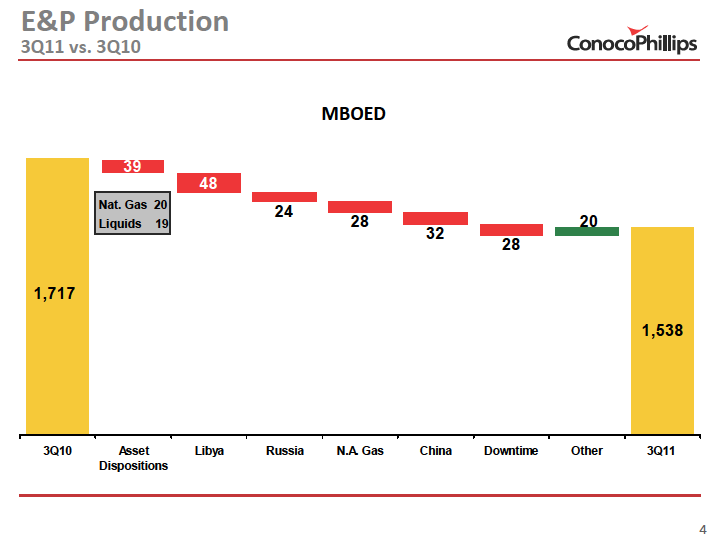
ConocoPhillips, #6
October 26, 2011 |
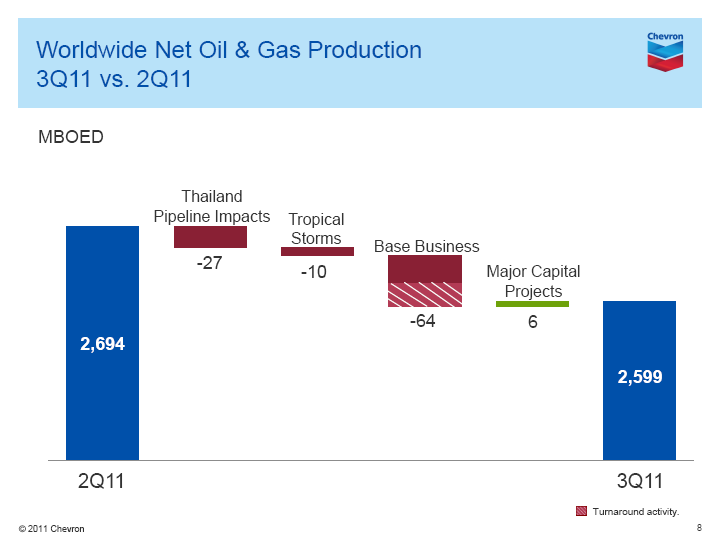
Chevron has an Enterprise Value of $202 billion and production of 2.6 MMboe/d in 3Q 2011. In 3Q 2011, Chevron earned $7.8 billion ($6.2 billion from Upstream), increased its dividend 3.8% and repurchased $1.25 billion of stock. Looking forward, Chevron expects ~1% CAGR in production through 2014 before ramping up to a 4-5% level through 2017. |
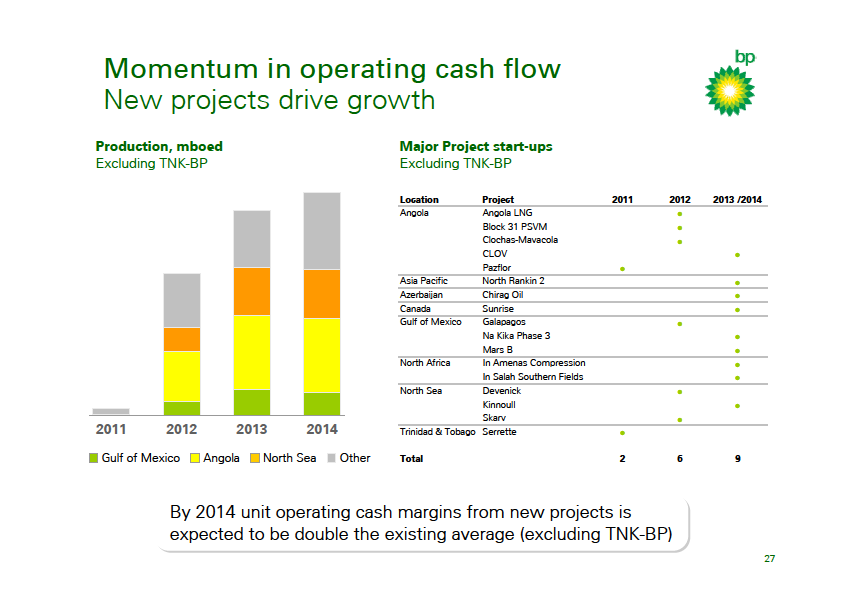
BP has an Enterprise Value of $166 billion. In 3Q 2011, BP had a replacement cost profit of $5.3 billion versus $5.5 billion in the year ago period. E&P results improved in the period despite production declining 12%. For the quarter, BP added $4.5 billion cash raising the cash balance to $18 billion. Looking forward, BP plans $15 billion in additional asset sales by 2013. |
Total has an Enterprise Value of $130 billion. The slide above is from Total's 2011 Investor Day -- entitled "New Dynamic, Near term growth and financial strength". In the presentation, Total upgraded its Upstream production growth to 2.5%/year through 2015 (based on $100/bbl Brent). Fueling growth is exploration plus acquisitions of 3.4 Bboe. |
ConocoPhillips has an Enterprise Value of $116 billion and production of 1.5 MMboe/d in 3Q 2011. COP is on track to split into an E&P and Downstream company scheduled for 2Q 2012. As a standalone E&P, Conoco's 1.5 MMboe/d will vault the company to #1 Super Independent, eclipsing Occidental Petroleum who produced 743 Mboe/d in 3Q 2011. |