Peak Oil? History
October 27, 2011 |
Peak Oil? Future
October 27, 2011 |
Breakeven Prices 1
October 27, 2011 |
Breakeven Prices 2
October 27, 2011 |
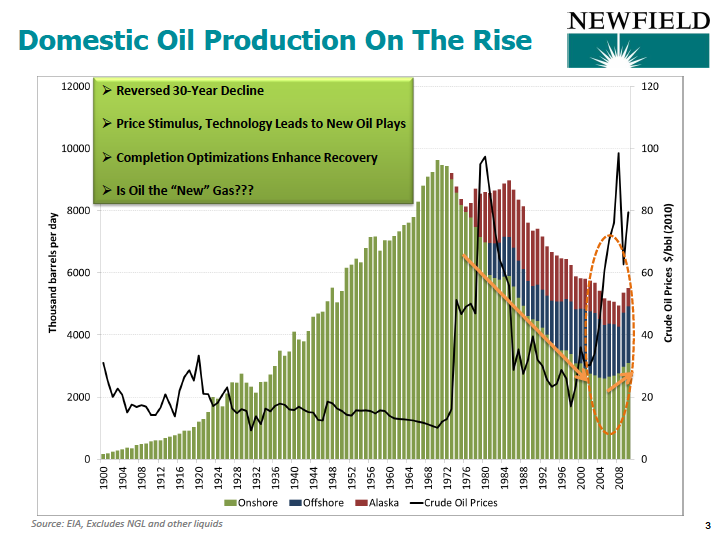
Courtesy of Newfield, this slide dramatically shows the REVERSAL of 30 years of domestic oil declines. Pay particular attention to the green bars which shows onshore US oil production bottoming in 2005 at less than 3 MMbbls/d. Click for the full presentation. |
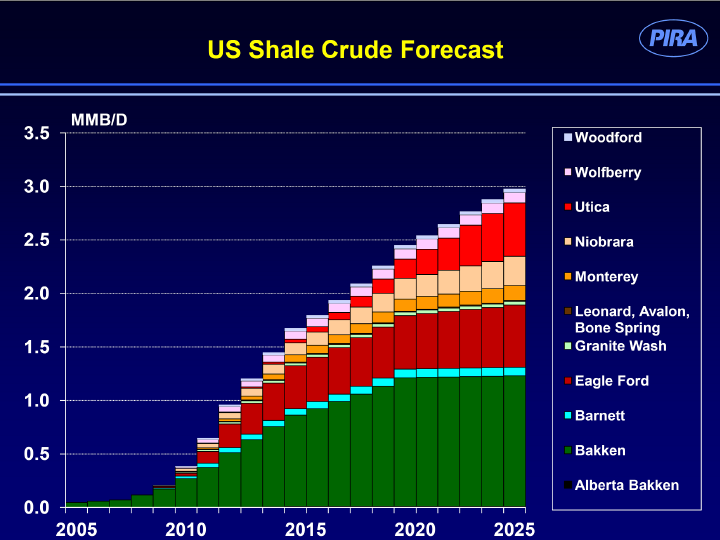
Courtesy of Newfield (sourced by PIRA), this slide from the same presentation shows oil growth to 3.0 MMbbls/d by 2025. When viewed in context of the slide on the left, the oil shales are expected to produce the same amount as ALL onshore US oil in 2005. |
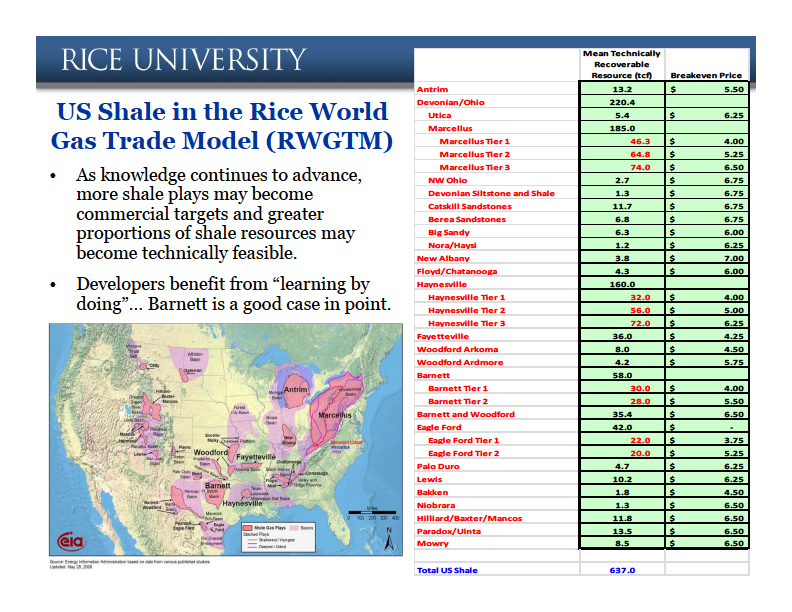
In a presentation addressing the impact of gas shales geopolitically, PLS captures this slide which presents Mean Technically Recoverable Resources (Tcf) of natural gas by play versus the Breakeven price. Only Eagle Ford Tier 1 is profitable at sub $4 gas. |
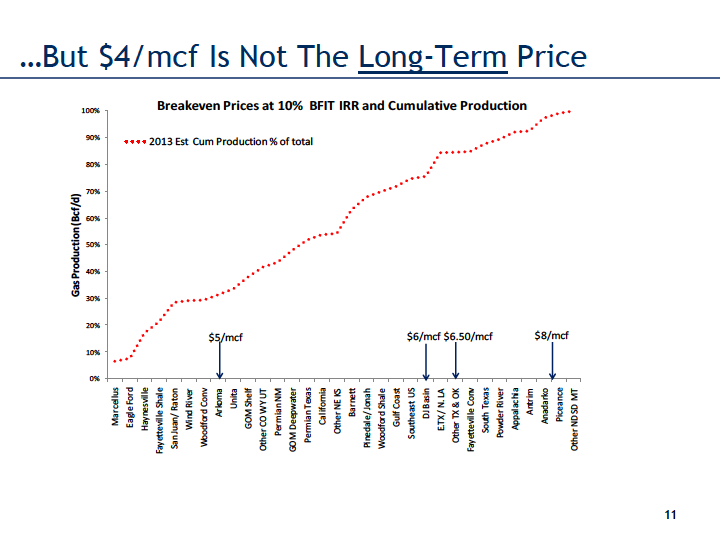
Courtesy of Tudor Pickering & Holt & Co., is another slide of each gas shale versus breakeven price. The key takeaway of this is that $4 gas is NOT the LONG TERM price. In terms of profitability, this slide ranks the Marcellus as the best gas shale in the country. Click here for the presentation. |